Brenham, TX vs Renton, WA
Side-by-side comparison of housing, income, commute, safety, and quality of life.
Score Snapshot
No universal winner
Scores summarize the published model. Use the objective metric differences below and your own priorities to choose.
Brenham
66.6
#1518 nationally
Renton
63.3
#1781 nationally
Renton leads in median household income ($92,292 vs $52,664). Brenham leads in average commute (18.3 min vs 30.8 min). Renton leads in crime level (9.3 vs 14.5).
Metric-by-Metric Breakdown
| Metric | Brenham, TX | Renton, WA |
|---|---|---|
| WhereAtHome Score | 66.6 (#1518) | 63.3 (#1781) |
| Population | 19,142 | 104,491 |
| Typical Home Value (ZHVI) | $329,916 | $746,360 |
| Median Household Income | $52,664 | $92,292 |
| Average Commute | 18.3 min | 30.8 min |
| Walk Score | N/A | 40 |
| Crime Level | 14.5 | 9.3 |
| School Rating | N/A | N/A |
| Cost of Living Index | 98 | 144 |
| Political lean County 2024 presidential margin — context only, not scored | R+54.7 | D+51.7 |
Data coverage note: Brenham is missing data for 1 metric that Renton has. Scores with less coverage are penalized — see our methodology.
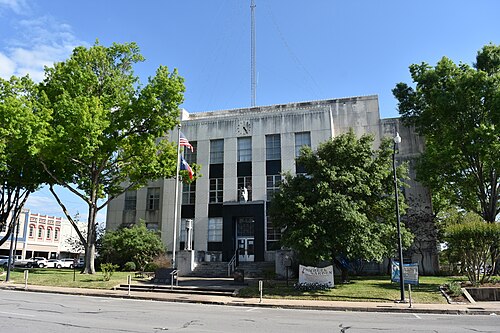
D
66.6 Score
Brenham, TX
Small Texas city with local appeal
Median Home
$329,916
Population
19,142
Crime
Moderate-High
Median Income
$52,664
Southwest
View Brenham, TX →

D
63.3 Score
Renton, WA
Mid-size Washington city with community character
Median Home
$746,360
Population
104,491
Crime
Moderate
Walk Score
40
Pacific
View Renton, WA →