Buffalo, NY vs Lancaster, PA
Side-by-side comparison of housing, income, commute, safety, and quality of life.
Score Snapshot
No universal winner
Scores summarize the published model. Use the objective metric differences below and your own priorities to choose.
Buffalo
74.2
#613 nationally
Lancaster
63.7
#413 nationally
Lancaster leads in median household income ($61,014 vs $42,891). Lancaster leads in walk score (81 vs 66). Buffalo leads in cost of living index (88 vs 93).
Metric-by-Metric Breakdown
| Metric | Buffalo, NY | Lancaster, PA |
|---|---|---|
| WhereAtHome Score | 74.2 (#613) | 63.7 (#413) |
| Population | 276,807 | 57,153 |
| Typical Home Value (ZHVI) | $249,040 | $0 |
| Median Household Income | $42,891 | $61,014 |
| Average Commute | 22.4 min | 23 min |
| Walk Score | 66 | 81 |
| Crime Level | Moderate-High | 9.5 |
| School Rating | 4.6 | N/A |
| Cost of Living Index | 88 | 93 |
| Political lean County 2024 presidential margin — context only, not scored | D+9.7 | R+15.9 |

C
74.2 Score
Buffalo, NY
Queen City rising
Median Home
$249,040
Population
276,807
Crime
Moderate-High
Schools
C
Northeast
View Buffalo, NY →
—
Score
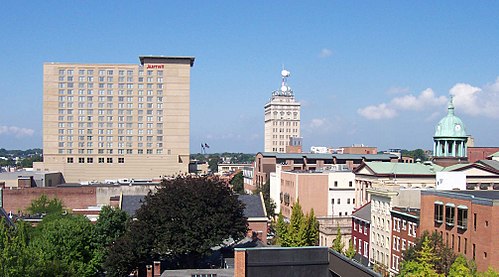
Lancaster, PA
Pennsylvania community balancing growth and livability
Population
57,153
Crime
Moderate
Walk Score
81
Median Income
$61,014
Northeast
View Lancaster, PA →