Gresham, OR vs Mount Pleasant, WI
Side-by-side comparison of housing, income, commute, safety, and quality of life.
Score Snapshot
No universal winner
Scores summarize the published model. Use the objective metric differences below and your own priorities to choose.
Gresham
65.6
#1622 nationally
Mount Pleasant
75.8
#417 nationally
Mount Pleasant leads in crime level (3.1 vs 11.2). Gresham leads in walk score (47 vs 20). Mount Pleasant leads in average commute (20.9 min vs 27.5 min).
Metric-by-Metric Breakdown
| Metric | Gresham, OR | Mount Pleasant, WI |
|---|---|---|
| WhereAtHome Score | 65.6 (#1622) | 75.8 (#417) |
| Population | 110,685 | 27,727 |
| Typical Home Value (ZHVI) | $470,730 | $350,442 |
| Median Household Income | $69,437 | $83,827 |
| Average Commute | 27.5 min | 20.9 min |
| Walk Score | 47 | 20 |
| Crime Level | 11.2 | 3.1 |
| School Rating | N/A | N/A |
| Cost of Living Index | 124 | 101 |
| Political lean County 2024 presidential margin — context only, not scored | D+62.1 | R+6.2 |

D
65.6 Score
Gresham, OR
Mid-size Oregon city with community character
Median Home
$470,730
Population
110,685
Crime
Moderate-High
Walk Score
47
Pacific
View Gresham, OR →
C
75.8 Score
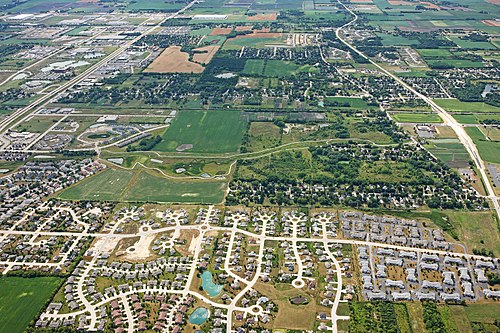
Mount Pleasant, WI
Small Wisconsin city with local appeal
Median Home
$350,442
Population
27,727
Crime
Low
Walk Score
20
Midwest
View Mount Pleasant, WI →
Try a different matchup
Swap Gresham for: